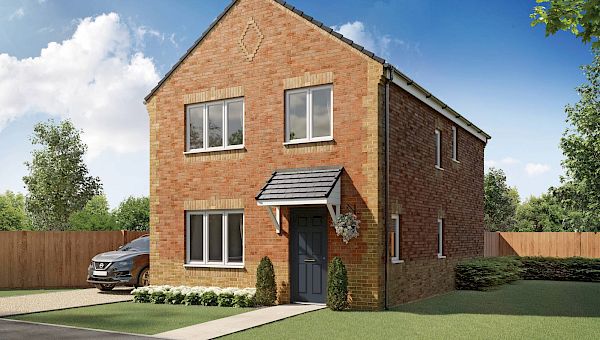
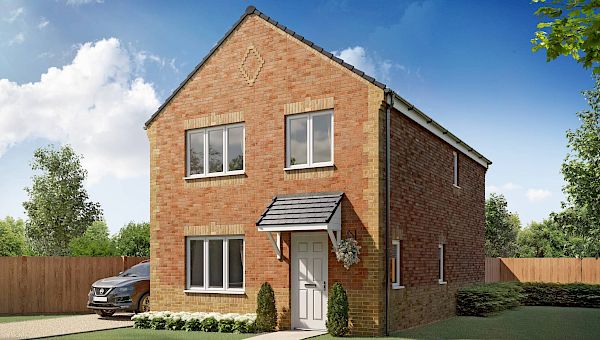
High Rental Growth New Builds in Knottingley WF11
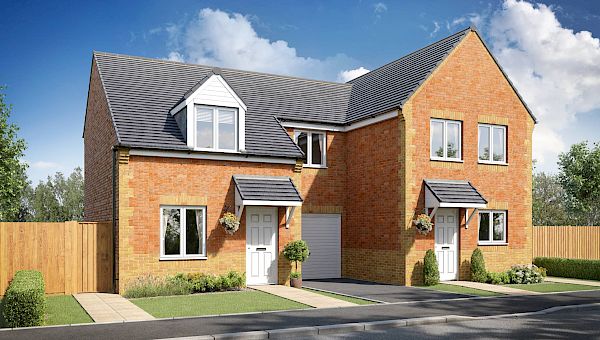
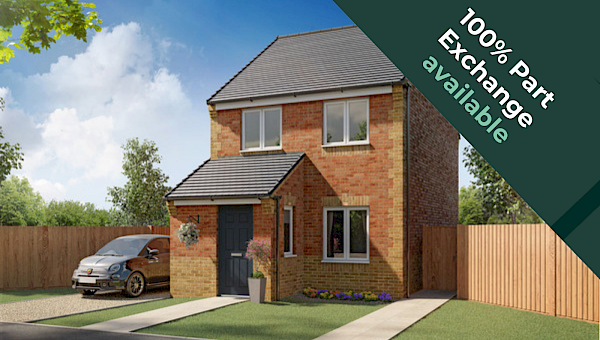
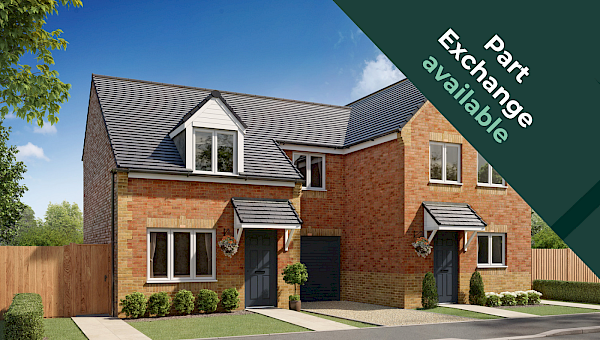
Explore 20 new build properties in Knottingley WF11.
20 High Rental Growth in Knottingley WF11
Showing 20 properties
 Available0
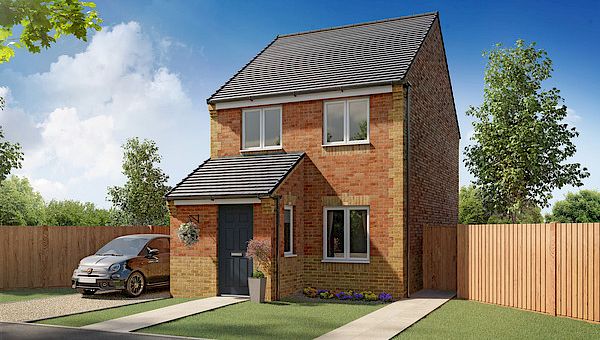
Plot 360 – Cork
Knottingley, WF11 0EW
Available0Plot 565 – Cork
Knottingley, WF11 0EW
 Available0
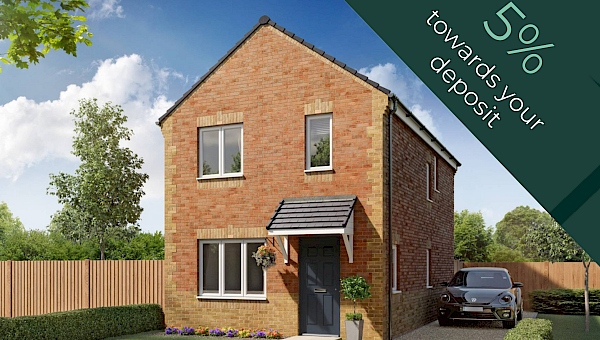
Plot 418 – Kilkenny
Knottingley, WF11 0EW
 Available0
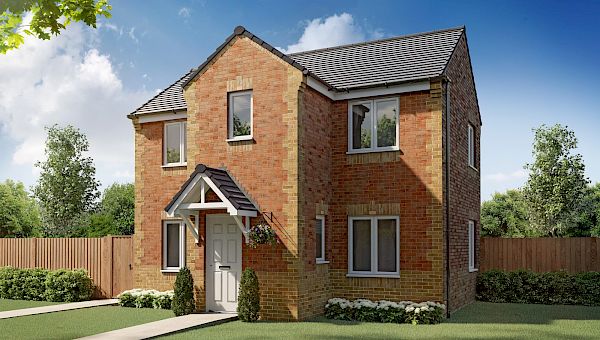
Plot 359 – Wexford
Knottingley, WF11 0EW
 Available0
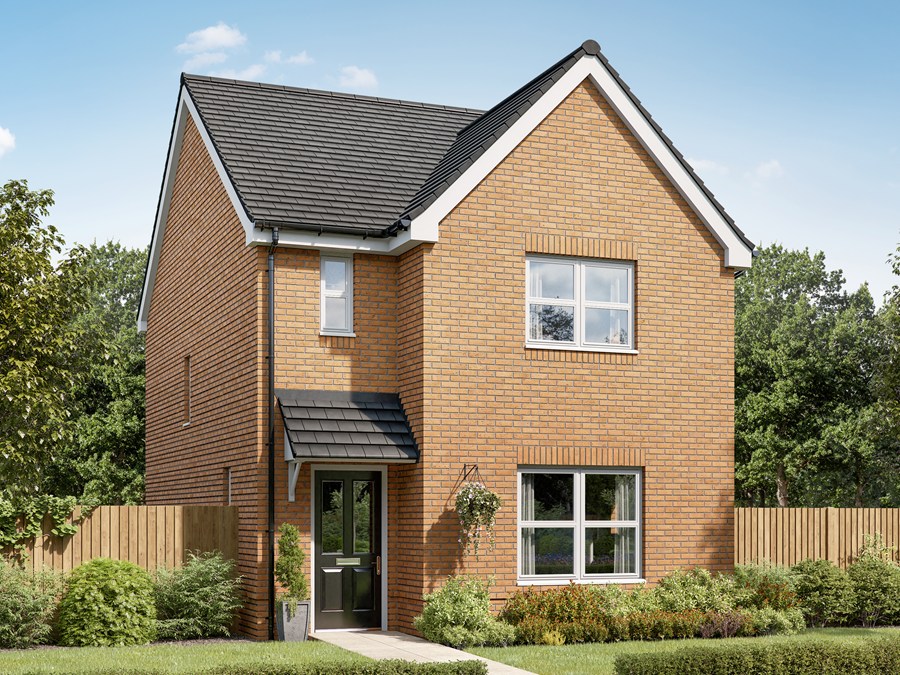
Plot 422 – Tyrone
Knottingley, WF11 0EW
 Available0
Plot 566 – Tyrone
Knottingley, WF11 0EW
 Available0
Plot 423 – Fergus
Knottingley, WF11 0EW
 Available0
Plot 555 – Kilkenny
Knottingley, WF11 0EW
 Available0
Plot 366 – Fergus
Knottingley, WF11 0EW
 Available0
Plot 420 – Brandon
Knottingley, WF11 0EW
 Available0
The Galloway
Knottingley, WF11 8BN
 Available0
Plot 421 – Kilkenny
Knottingley, WF11 0EW
 Available0
Plot 364 – Kilkenny
Knottingley, WF11 0EW
 Available0
Plot 419 – Brandon
Knottingley, WF11 0EW
 Available0
Plot 564 – Renmore
Knottingley, WF11 0EW
 Available0
The Sherwood
Knottingley, WF11 8BN
 Available0
Plot 563 – Longford
Knottingley, WF11 0EW
 Available0
The Burnham
Knottingley, WF11 8BN
 Available0
Plot 363 – Longford
Knottingley, WF11 0EW
 Available0
The Marston
Knottingley, WF11 8BN
Frequently Asked Questions
About High Rental Growth in Knottingley WF11
1How many new builds are in high rental growth areas in Knottingley WF11?
There are 20 new build properties in Knottingley WF11 in areas with 3%+ annual rental growth. Prices range from £195k to £315k.
2What is the average rental growth rate?
The average annual rental growth across these areas is 7.0%. Data is based on postcode-level market analysis.
3Why invest in high growth areas?
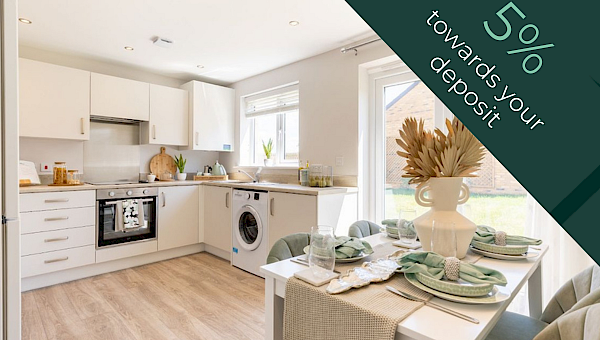
Properties in areas with strong rental growth benefit from increasing rental income over time. New builds start with modern specs and high EPC ratings.
4How reliable are the growth figures?
Growth data is sourced from Land Registry, ONS, and market analysis platforms, reflecting actual postcode-level trends. Past performance does not guarantee future results, but these areas show consistent upward trajectories.