High Price Growth New Builds in Redcar TS10
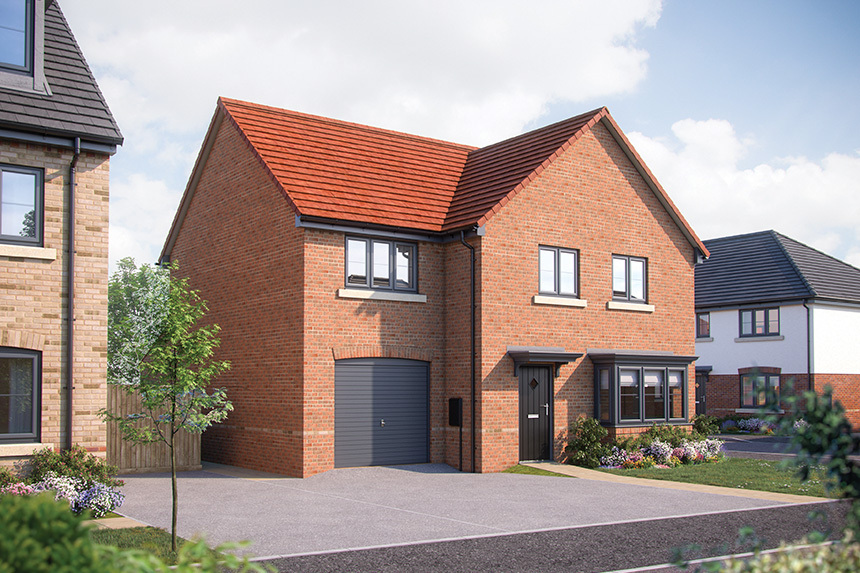
Explore 24 new build properties in Redcar TS10.
24 High Price Growth in Redcar TS10
Showing 24 properties
 Available0
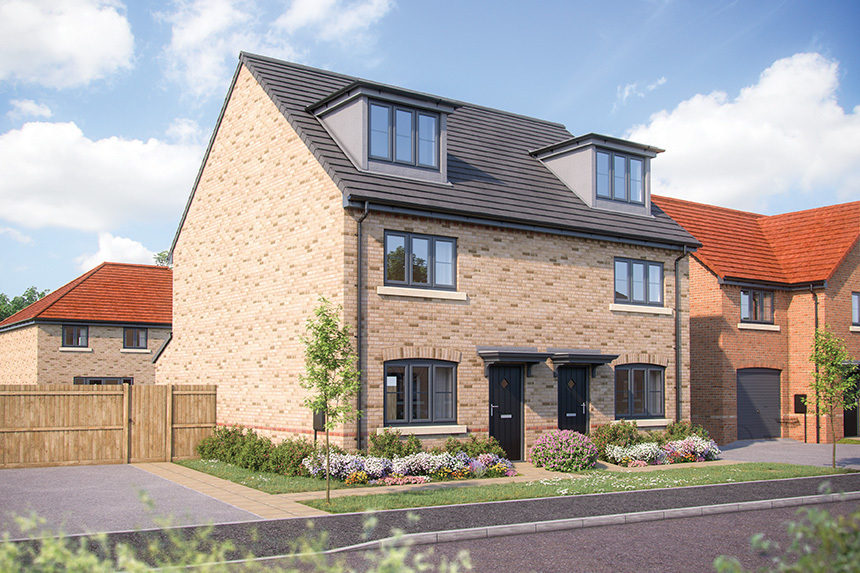
The Tulip
Redcar, TS10 5FJ
Available0The Tulip
Redcar, TS10 5FJ
 Available0
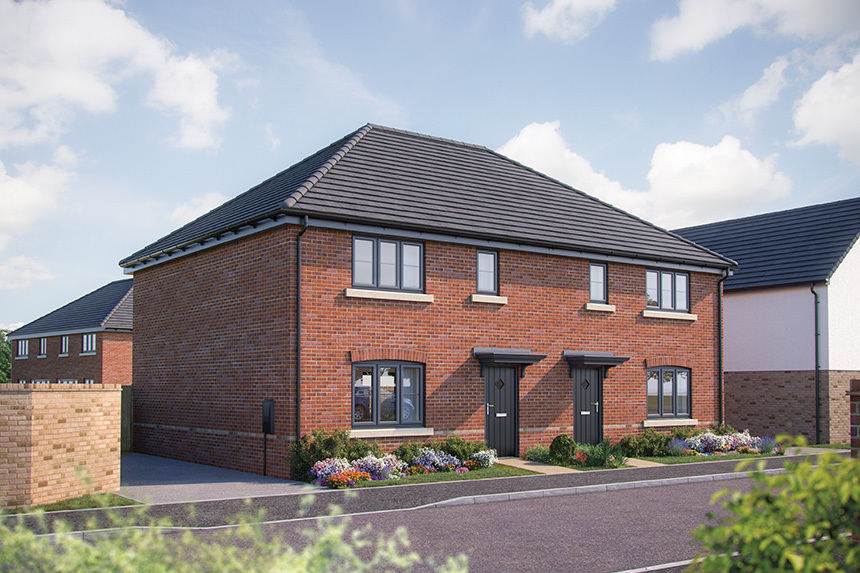
The Heather
Redcar, TS10 5FJ
Available0The Heather
Redcar, TS10 5FJ
Available0The Tulip
Redcar, TS10 5FJ
Available0The Tulip
Redcar, TS10 5FJ
 Available0
The Eynsford
Redcar, TS10 2UF
Available0The Eynsford
Redcar, TS10 2UF
 Available0
The Tulip
Redcar, TS10 5FJ
Available0The Tulip
Redcar, TS10 5FJ
 Available0
The Tulip
Redcar, TS10 5FJ
Available0The Tulip
Redcar, TS10 5FJ
 Available0
The Sunflower
Redcar, TS10 5FJ
 Available0
The Aynesdale
Redcar, TS10 2UF
 Available0
The Byrneham
Redcar, TS10 2UF
 Available0
The Chalham
Redcar, TS10 2UF
 Available0
The Honeysuckle
Redcar, TS10 5FJ
 Available0
The Larkspur
Redcar, TS10 5FJ
 Available0
The Colford
Redcar, TS10 2UF
 Reserved0
The Honeysuckle
Redcar, TS10 5FJ
Available0The Larkspur
Redcar, TS10 5FJ
Available0The Larkspur
Redcar, TS10 5FJ
 Available0
The Larkspur
Redcar, TS10 5FJ
Available0The Larkspur
Redcar, TS10 5FJ
Frequently Asked Questions
About High Price Growth in Redcar TS10
1How many new builds are in high price growth areas in Redcar TS10?
There are 24 new build properties in Redcar TS10 in areas with 3%+ annual price growth. Prices range from £240k to £355k.
2What is the average price growth rate?
The average annual price growth across these areas is 6.5%. Data is based on postcode-level market analysis.
3Why invest in high growth areas?
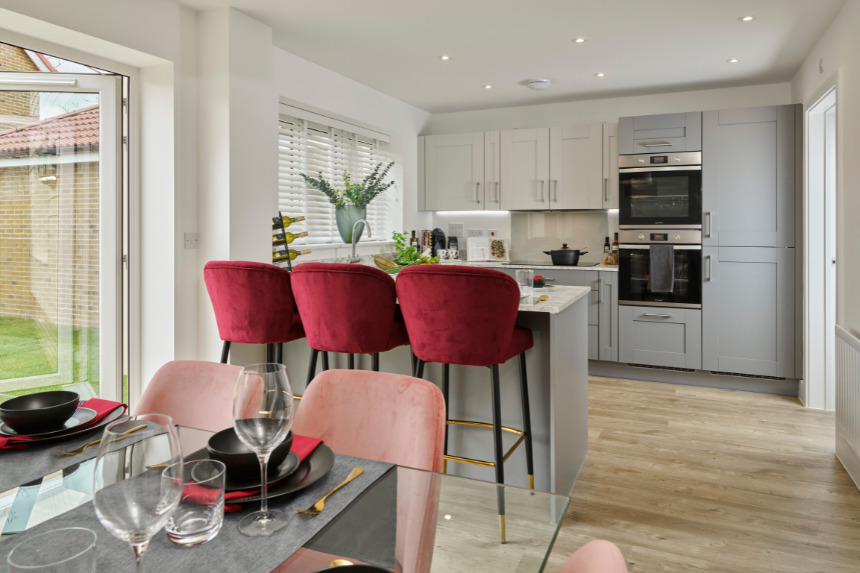
Properties in areas with strong price growth benefit from capital appreciation. New builds start with modern specs and high EPC ratings.
4How reliable are the growth figures?
Growth data is sourced from Land Registry, ONS, and market analysis platforms, reflecting actual postcode-level trends. Past performance does not guarantee future results, but these areas show consistent upward trajectories.