UK New Build Market: Year in Review 2025
Published by New-Builds Team
The year 2025 will be remembered as a pivotal chapter in the story of UK new build housing. After the turbulence of 2022-2023 — marked by the mini-budget mortgage shock, inflationary pressures on build costs, and collapsing buyer confidence — the new build sector entered 2025 on a cautiously optimistic footing. Mortgage rates had stabilised in the mid-4% range, planning reforms were beginning to unlock stalled sites, and the Labour government's ambitious housing targets had injected fresh urgency into the supply pipeline. By year-end, the data paints a picture of genuine recovery: completions rebounded, transaction volumes climbed, and the major housebuilders reported improved order books and strengthened balance sheets. Yet this was not a return to the frenzied growth of 2021; rather, it was a more measured, sustainable recovery shaped by tighter regulation, evolving buyer expectations, and the accelerating transition to higher energy standards.
For anyone who purchased, sold, or considered buying a new build home during 2025, this comprehensive review provides the full picture. We examine every significant data point, policy shift, and market development that defined the year, bringing together figures from NHBC, DLUHC, ONS, HM Land Registry, and the major housebuilders' own reporting. Whether you are an investor tracking market fundamentals, a first-time buyer trying to understand pricing trends, or a developer benchmarking your performance against the sector, this is the definitive account of what happened in UK new build housing in 2025.
Completions and Supply: The Numbers
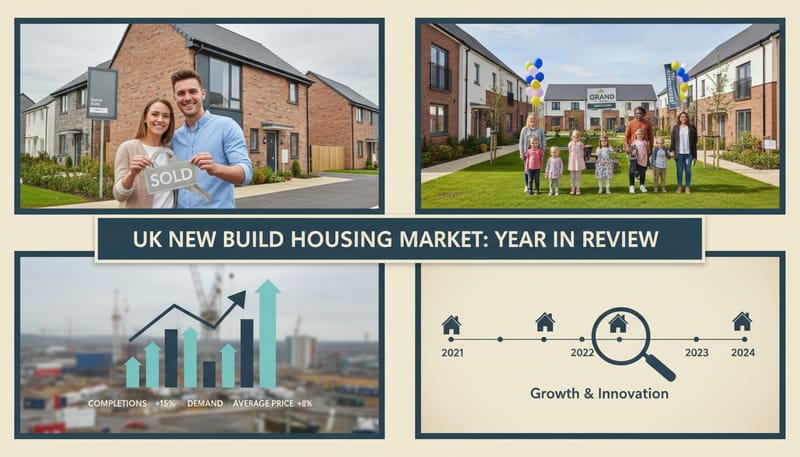
New build completions are the most fundamental measure of housing supply delivery. After falling to their lowest level in five years during 2023/24 — when the hangover from mortgage rate increases caused widespread site slowdowns and project delays — 2025 saw a meaningful recovery. NHBC registration data, which serves as the industry's primary forward indicator, had already signalled the upturn, and the completions figures now confirm it.
Total new build completions reached approximately 224,300 units in calendar year 2025, an 11% increase on 2024's subdued figure of approximately 202,000. While this represents a strong recovery, it remains below the 2019 peak of 243,000 and significantly short of the government's target run-rate needed to deliver 1.5 million homes over the parliamentary term. The private sector accounted for 168,200 completions, while affordable housing (including shared ownership, affordable rent, and social rent) contributed 56,100 — the latter boosted by Homes England's increased grant funding and Vistry Group's expanding partnerships model.
Five-Year Completions Trend
Sources: DLUHC Housing Supply Statistics, NHBC Registration Data. 2025 figures are provisional estimates.
NHBC registrations — the leading indicator for future completions — rose 18% year-on-year to approximately 152,800, suggesting that the completions recovery should accelerate further into 2026. The registration rebound was particularly strong in H2 2025, reflecting improved sales rates and developers reopening paused sites in response to better market conditions.
Price Movements: Recovery with Regional Variation
New build house prices in 2025 told a story of modest recovery nationally, overlaid with significant regional variation. After nominal price falls of 2-5% through 2023-2024 (and real-terms falls of 6-9% once inflation was factored in), new build values stabilised in early 2025 and began to edge higher from the spring selling season onwards. However, the recovery was far from uniform, and the new build premium over existing stock shifted considerably.
Regional New Build Price Performance
| Region | Avg New Build Price | Annual Change | NB Premium |
|---|---|---|---|
| London | £562,000 | +2.1% | 18% |
| South East | £435,000 | +3.8% | 24% |
| South West | £378,000 | +4.1% | 26% |
| East of England | £402,000 | +3.5% | 23% |
| East Midlands | £298,000 | +4.5% | 25% |
| West Midlands | £312,000 | +3.9% | 22% |
| North West | £278,000 | +4.8% | 24% |
| Yorkshire & Humber | £265,000 | +5.2% | 23% |
| North East | £225,000 | +5.8% | 21% |
| Scotland | £272,000 | +4.2% | 20% |
| Wales | £258,000 | +3.6% | 19% |
The pattern is clear: northern regions and areas with stronger affordability ratios saw the strongest price growth, while London — where affordability constraints are tightest — saw the most muted recovery. The North East led with 5.8% growth, reflecting both a lower base and strong demand for affordable new build homes. The new build premium over existing stock ranged from 18% in London to 26% in the South West, reflecting the relative scarcity of quality new supply in high-demand rural and coastal markets.
Key Policy Changes That Shaped 2025
Government policy was an unusually active force in the new build market during 2025. The Labour government, elected in July 2024 with a clear mandate to build more homes, wasted little time implementing a series of reforms that reshaped the operating environment for developers, local authorities, and buyers. For a deeper analysis, see our dedicated piece on how government policy is shaping new build markets.
Top Developer Performance
The major listed housebuilders reported markedly improved results for their 2025 financial years, reflecting both the market recovery and operational restructuring. The defining corporate event of the year was the completion of the Barratt-Redrow merger, creating the UK's largest housebuilder by completions volume. Beyond the headlines, the performance data reveals clear divergence between developers who adapted quickly to the new operating environment and those still in transition.
| Developer | Completions | Revenue | ASP | Change |
|---|---|---|---|---|
| Barratt Redrow | ~21,500 | £6.8bn | £316K | +15%* |
| Persimmon | ~10,800 | £3.3bn | £268K | +8% |
| Taylor Wimpey | ~10,400 | £3.8bn | £352K | +6% |
| Bellway | ~8,200 | £2.8bn | £332K | +10% |
| Vistry Group | ~16,400 | £4.2bn | £256K | +12% |
| Berkeley Group | ~4,100 | £2.6bn | £598K | +4% |
*Barratt Redrow comparison reflects combined entity. ASP = Average Selling Price. Figures are approximate based on published results and analyst estimates.
The standout performer was Vistry Group, which completed its transformation into a predominantly partnerships-focused business. By delivering homes primarily through housing association and local authority agreements, Vistry insulated itself from the volatility of the open-market sales cycle while accessing the expanding affordable housing budget. Its completions rose 12% and its forward order book at year-end was the strongest in its history.
Notable Developments and Milestones
Beyond the headline data, 2025 was punctuated by a series of landmark developments and industry milestones that captured the direction of travel for the sector.
Mortgage Market and Buyer Affordability
The mortgage market was central to the new build recovery story. After the disruption of 2022-2023, when average new build mortgage rates briefly exceeded 6%, the gradual normalisation of rates through 2024 and into 2025 restored buyer confidence and purchasing power. The Bank of England's July rate cut to 4.25% — followed by a further reduction to 4.00% in November — gave the market a significant psychological and practical boost.
The availability of green mortgage products expanded significantly during 2025. By year-end, over 40 lenders offered some form of green mortgage incentive for energy-efficient homes, compared to just 15 at the start of 2024. For buyers of new build homes — which overwhelmingly achieve EPC B or above — this meant access to rates approximately 0.10-0.25% below standard products, translating to meaningful savings over a mortgage term. See our mortgage rates guide for current deals.
Energy Standards and Sustainability
The energy transition remained a defining theme. With the Future Homes Standard approaching implementation, 2025 saw accelerating adoption of heat pumps, solar PV, and enhanced building fabric across the new build sector. Key metrics for the year include:
The Build-to-Rent Boom
One of the most significant structural shifts in the new build market has been the continued growth of the Build-to-Rent (BTR) sector. Institutional investment in purpose-built rental housing reached record levels in 2025, with the British Property Federation reporting that the BTR pipeline grew to over 260,000 homes either completed, under construction, or in planning. Of these, approximately 85,000 were completed units, with a further 48,000 under construction during the year.
The BTR sector's growth is significant for the new build market because it provides developers with an alternative sales channel that is less dependent on individual buyer mortgage availability. Major investors including Legal & General, Greystar, and Goldman Sachs expanded their UK BTR portfolios substantially, with total institutional investment in the sector exceeding £5.2 billion during 2025. For an analysis of the investment landscape, see our investment guide.
Build Cost Trends and Material Inflation
Build costs were a defining concern for the new build sector throughout 2025, though the picture improved considerably compared to the acute inflationary pressures of 2022-2023. The BCIS (Building Cost Information Service) All-In Tender Price Index, the most widely used measure of construction cost inflation, showed an annual increase of 3.8% for 2025 — significantly lower than the 8-12% increases seen in 2022 and 2023, but still above the Bank of England's 2% inflation target and sufficient to squeeze developer margins on sites acquired during the peak pricing period.
The composition of build cost inflation shifted notably during the year. Materials costs, which had been the primary driver of inflation in 2022-2023, moderated significantly as global supply chains normalised and commodity prices stabilised. The BEIS Construction Materials Price Index showed materials inflation of just 2.1% for the year, with timber, steel, and concrete all within normal ranges. However, labour costs accelerated to 5.4% annual growth, driven by persistent skills shortages across key trades — particularly bricklayers, electricians, and the newly critical heat pump installation specialists.
The Construction Industry Training Board (CITB) reported that the sector needed to recruit 225,000 additional workers by 2028 to meet projected demand, including the government's housing targets. Apprenticeship starts in construction rose 12% in 2025, a positive sign, but from a low base that remains insufficient to close the skills gap in the near term. The implications for new build pricing are clear: as long as labour costs continue to outpace general inflation, developers face a structural cost headwind that must be absorbed through some combination of higher selling prices, lower land values, and compressed margins.
Average Build Cost Per Square Metre
| House Type | Cost/m² (2024) | Cost/m² (2025) | Change |
|---|---|---|---|
| 3-bed detached (estate housing) | £1,520 | £1,578 | +3.8% |
| 4-bed detached | £1,650 | £1,713 | +3.8% |
| 2-bed apartment (low-rise) | £1,880 | £1,955 | +4.0% |
| High-rise apartment (London) | £3,200 | £3,344 | +4.5% |
Source: BCIS, RICS Building Cost Data. Excludes land, external works, and abnormals. Includes FHS compliance uplift where applicable.
Looking ahead, the industry consensus is that build cost inflation will moderate further towards 3-4% in 2026, barring any major supply chain disruptions. However, the additional cost of Future Homes Standard compliance — estimated at £5,000-£10,000 per unit — represents a step-change in the cost base that will persist regardless of cyclical conditions. Developers who have invested early in supply chain agreements for heat pumps, MVHR systems, and enhanced insulation products are likely to have a cost advantage over those scrambling to comply at the last minute.
SME Builders: A Critical but Struggling Segment
The health of the SME housebuilding sector — defined as firms building fewer than 500 homes per year — remained a significant concern in 2025. SME builders historically accounted for over 40% of new housing output in the 1980s; by 2025, their share had fallen to approximately 12%. The Federation of Master Builders (FMB) and the National Federation of Builders (NFB) both highlighted the continued structural challenges facing smaller firms: disproportionate regulatory burdens, difficulties accessing development finance, high planning costs relative to scheme size, and the competitive disadvantage of being unable to spread FHS compliance costs across thousands of units.
The government acknowledged this concern with several targeted measures during 2025. The Planning and Infrastructure Bill included provisions for simplified planning processes for sites of 10 or fewer units, reducing the documentation requirements and application fees for small-scale developments. Homes England also expanded its Home Building Fund to provide development finance on more favourable terms for SME builders, with an additional £500 million allocation announced in the Autumn Statement. These measures are welcome, but the FMB has argued that more fundamental reform is needed — including a rethink of the Infrastructure Levy's impact on small sites and dedicated support for SME builders navigating the FHS transition — if the government is serious about diversifying the supply base beyond the major volume builders.
Customer Satisfaction and Quality
New build quality and customer satisfaction remained firmly in the spotlight. The HBF's annual National New Homes Survey reported an overall customer satisfaction rate of 88% for 2025, a modest improvement on the 87% recorded in 2024 but still below the pre-pandemic peak of 91%. The New Homes Quality Code (NHQC), which replaced the Consumer Code for Housebuilders in 2024, continued to embed higher standards across the industry.
The continued high rate of reported snags (92% of buyers reported at least one issue) remains a challenge for the industry's reputation. However, the more relevant metric is how these issues are resolved: the proportion of buyers who said their problems were dealt with satisfactorily rose to 76%, up from 71% in 2024, suggesting that aftercare processes are improving even if initial build quality has further to go. For more on buyer sentiment and confidence, see our dedicated analysis.
Land Market and Development Pipeline
The land market showed tentative signs of recovery in 2025 after a period of significant correction. Land values had fallen 15-25% from their 2022 peaks as developers recalibrated their residual land value calculations to reflect higher build costs and the additional expenditure required for FHS compliance. By mid-2025, however, selective land buying resumed as developers sought to replenish their landbanks ahead of the anticipated planning reform benefits.
Savills reported that greenfield land values stabilised in H2 2025 and edged up by 2-3% from their trough, while brownfield values — buoyed by government brownfield-first policies and infrastructure investment — showed stronger recovery of 5-7%. The total planning pipeline of sites with permission or resolution to grant stood at approximately 1.1 million plots at year-end, though the conversion rate from permission to construction start remained a concern, with DLUHC data showing that only 48% of permitted sites begin construction within two years.
Outlook for 2026
Heading into 2026, the fundamentals for the UK new build market are the most supportive they have been in three years. Mortgage rates are expected to decline further as the Bank of England continues its easing cycle, with market consensus pointing to a base rate of 3.50-3.75% by year-end 2026. Planning reforms are beginning to unlock previously stalled sites, and the affordable housing budget has been materially increased. The major developers have rebuilt their order books and are signalling increased output targets.
- Further Bank of England rate cuts expected
- Planning reforms unlocking more land
- Increased affordable housing funding
- Pent-up demand from 2023-2024 deferrals
- Expanding green mortgage availability
- Growing BTR institutional investment
- FHS transition costs pressuring margins
- Skilled labour shortages persist
- Build cost inflation (materials + wages)
- Stamp duty changes suppressing first-time demand
- Geopolitical uncertainty affecting confidence
- NIMBY resistance to reformed planning system
Industry forecasts for 2026 completions range from 235,000 to 250,000 units, which would represent a further 5-12% increase on 2025 and move the sector closer to — though still below — the run-rate needed for the government's 1.5 million homes target. The key variable remains the speed of planning reform implementation and the ability of the construction sector to scale up capacity without triggering unsustainable cost inflation.
Frequently Asked Questions
Final Thoughts
The UK new build market in 2025 was defined by recovery, reform, and repositioning. After two challenging years, the sector demonstrated its resilience and adaptability, delivering increased volumes into a market that was slowly but surely normalising. The policy environment, while demanding higher standards and greater accountability, also provided the clearest direction of travel the industry has had in years.
For buyers, the takeaway is broadly positive: more choice, better quality, improving affordability, and homes that will perform well for decades to come. For investors, the fundamentals of undersupply, supportive policy, and demographic demand remain firmly intact. And for the industry itself, the challenge is clear — scale up delivery while maintaining quality, adapting to net-zero requirements, and closing the gap between ambition and reality on the government's housing targets.
To explore current opportunities, browse available new build homes across the UK, or read our first-time buyer guide for step-by-step purchasing advice.